
- by sedlv
- October 21 2025
By Ross Youngs, The classic ‘magic‐bullet’ strategy—maximally selective ligands for single targets—is well suited to simple causal architectures but less effective for diseases driven by robust and redundant networks (e.g., cancer, metabolic and neurodegenerative disorders). When one pathway is blocked, compensatory signaling can restore the disease phenotype. Network pharmacology, therefore, prioritizes coordinated modulation across multiple nodes to achieve a systems‐level therapeutic effect. Think of discovery as finding the right key for a biological lock. In the synthetic world, scientists act as locksmiths—designing and forging millions of keys, hoping one will fit. In the microbial world, we’re treasure hunters: microbes have fought microscopic battles for eons, evolving an arsenal of complex, bioactive ‘keys’ that already fit many biological locks. The capitalized‑cost math reveals which approach scales more efficiently. Because microbial NPs begin life with evolution‑selected motifs and tractable ADME/tox profiles more often than synthetic starting points, they traverse this gauntlet with fewer losses, translating directly into lower capitalized cost. Capitalized cost counts not just the winner, but every sibling that failed along the way. The table below shows the number of candidates the portfolio must carry at each stage to produce one approval, and the corresponding spend. Shift earlier toward NP‑sourced leads. Concretely: enrich screening libraries with microbial NP diversity; add NP‑aware, LC‑MS/MS‑anchored in‑silico triage; and tune stage‑gates to reward evolutionary motifs tied to developability (solubility, permeability, metabolic stability) and translational efficacy. The data are unequivocal: starting with microbial natural products reduces the final capitalized cost from nearly $1,487.7 million to about $446.5 million—a savings of more than $1,041.2 million per approval. Evolution has already done much of the heavy lifting; smart portfolios should exploit that advantage. Newman, David J., and Gordon M. Cragg. “Natural Products as Sources of New Drugs over the Nearly 40 Years from 01/1981 to 09/2019." Journal of Natural Products, vol. 83, no. 3, 2020, pp.770–803. Paul, Steven M., et al. “How to improve R&D productivity: the pharmaceutical industry’s grand challenge." Nature Reviews Drug Discovery, vol. 9, no. 3, 2010, pp. 203–214. Wong, Chi Heong, Kien Wei Siah, and Andrew W. Lo. “Estimation of clinical trial success rates and related parameters." Biostatistics, vol. 20, no. 2, 2019, pp. 273–286. Wouters, Olivier J., Martin McKee, and Jeroen Luyten. “Estimated Research and Development Investment Needed to Bring a New Medicine to Market, 2009–2018." JAMA, vol. 323, no. 9, 2020, pp. 844–853.
September 23, 2025The Evolutionary Advantage: Why Microbial Chemistry Wins in Drug Discovery & Approval
Quantifying Success and Capitalized Cost Savings from Lead Identification
Executive Summary
The Two Worlds of Drug Discovery
The Great Filter: Why Most Drugs Fail
A Tale of Two Cascades: The Capitalized Cost
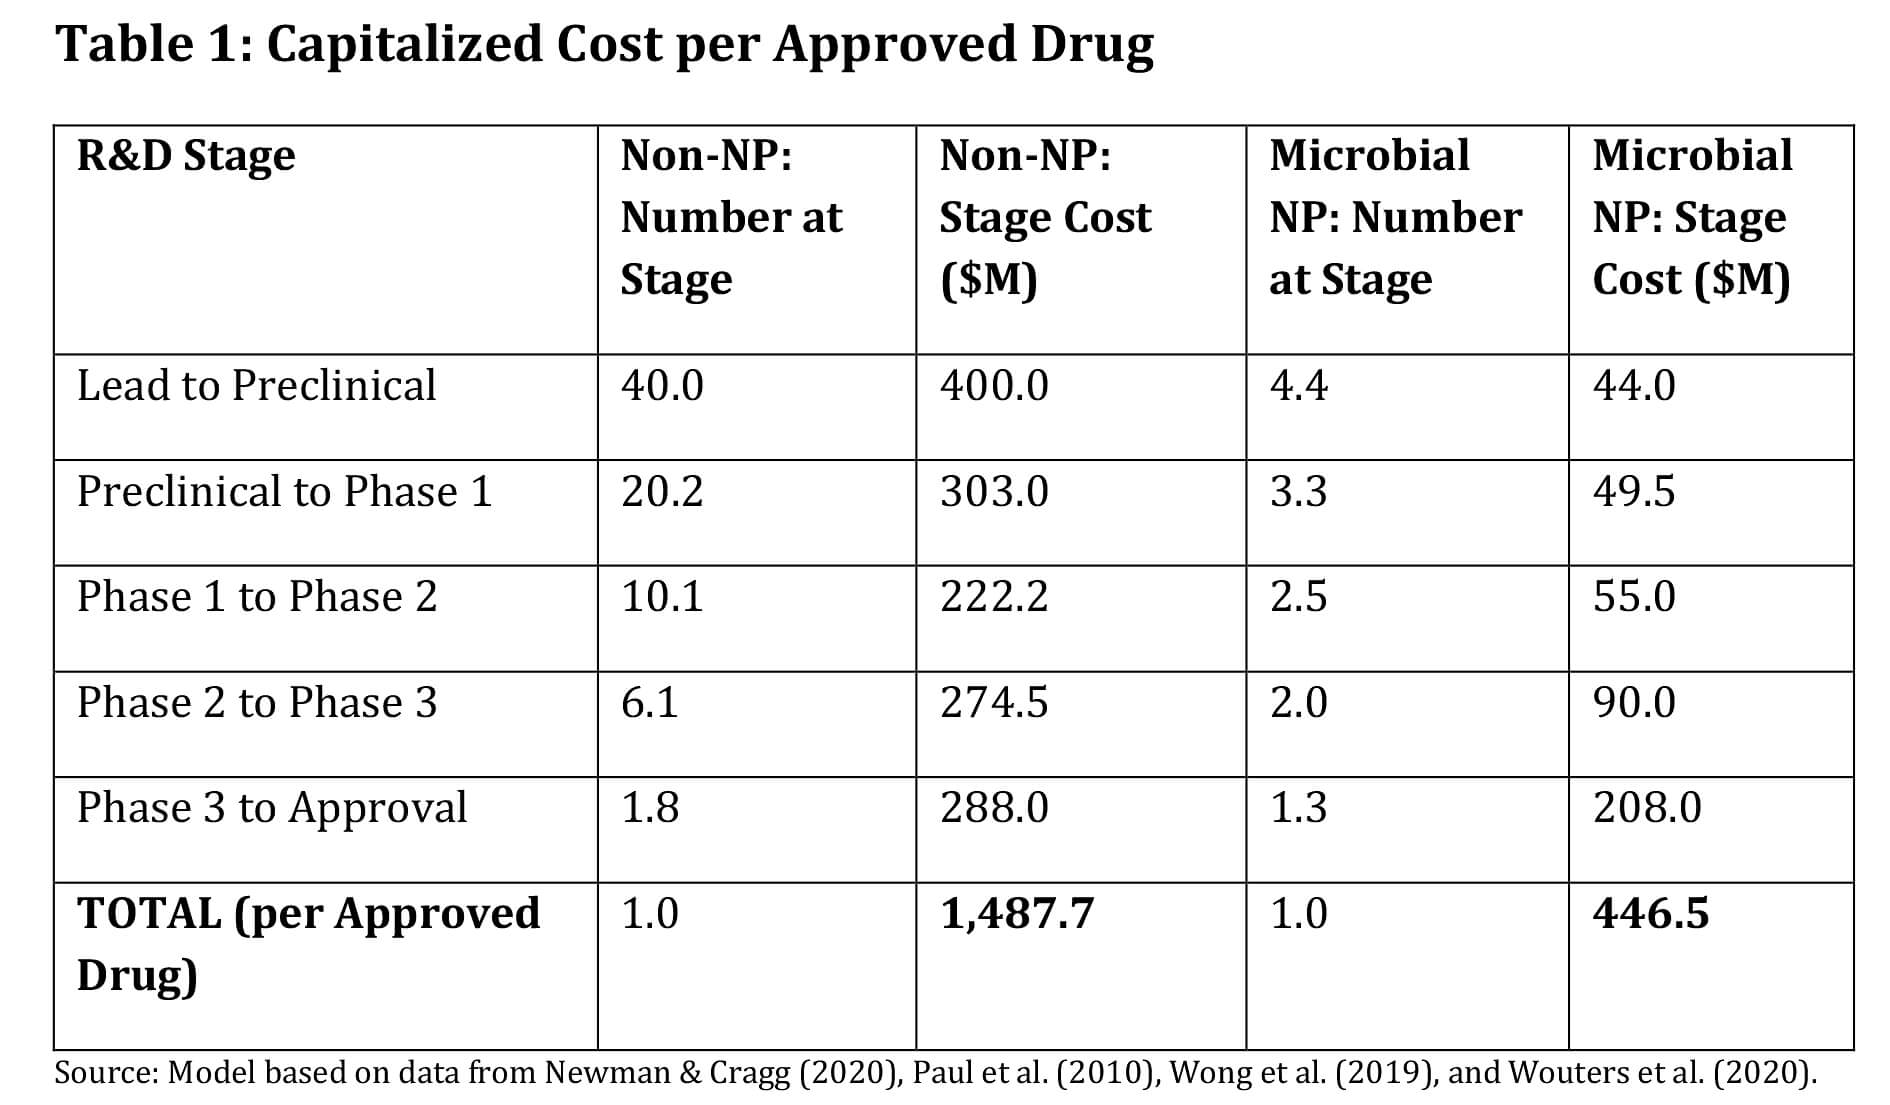
Figure 1. Capitalized Cost per Approved Drug Graphically Modeled
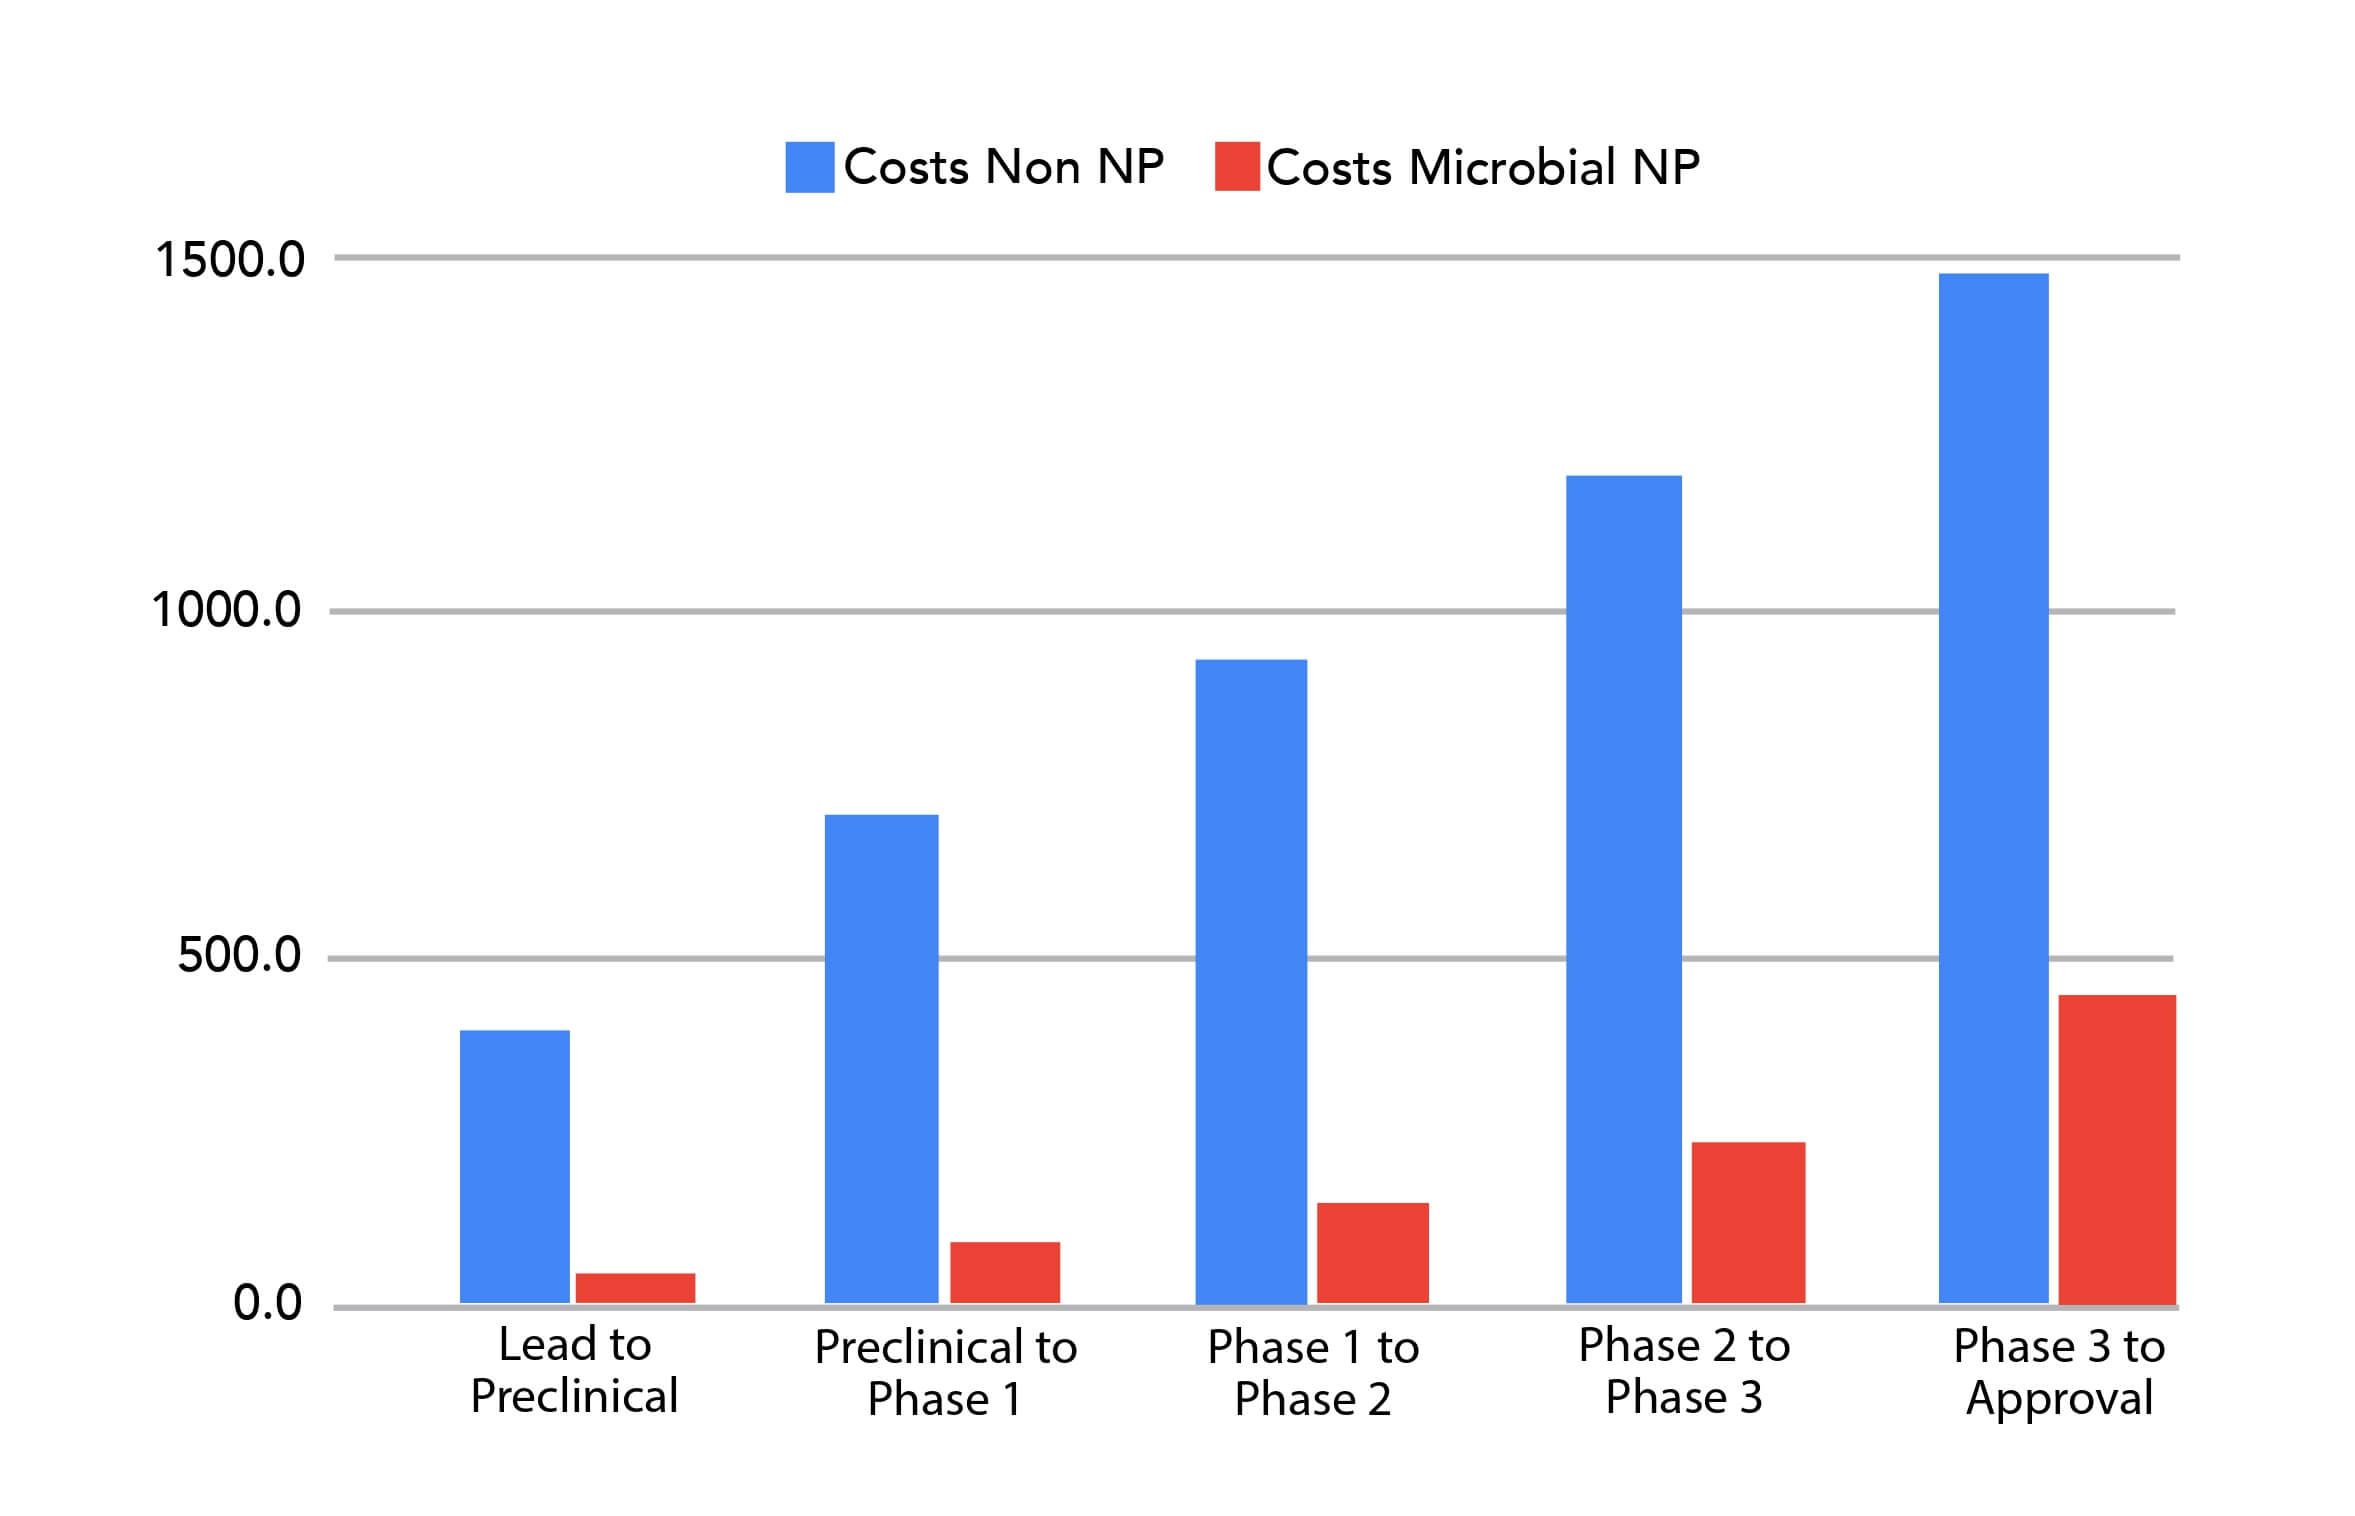
Bars reflect the sum of stage costs multiplied by the number entering each stage, using source data. Synthetic (Non‑NP): ~$1,487.7M; Microbial NP: ~$446.5M; Savings: ~$1,041.2M per approval.What This Means for Strategy
Conclusion: A Clear Path Forward
References (MLA Format)